Evidence of Social Problem Outcome
Evidence 1:
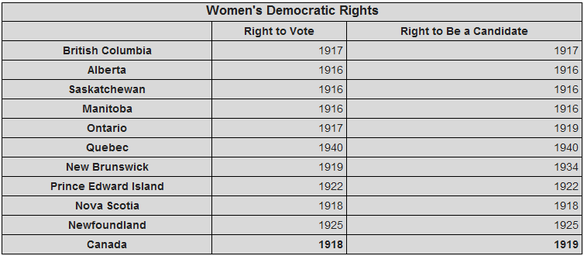
Table 1: Women's Democratic Rights (courtesy of http://www.elections.ca/content.aspx?section=res&dir=his&document=chap2&lang=e)
The table to the left shows the specific years that women were given the right to vote, as well as the right to be a candidate. focusing on the left side of the column, we can see that the women of Canada were given suffrage between 1916 and 1940. This shows support of the concept of the problem being resolved, as each province eventually gave voting rights to women.
Evidence 2:
Bills, laws, and acts were amended or created in order to bring suffrage to the women of Canada. This specific information can be found at: http://www.parl.gc.ca/parlinfo/compilations/provinceterritory/ProvincialWomenRightToVote.aspx. All acts, bills, and statutes are listed below each piece of information. This proves that the social problem has been resolved, as each province, as well as the nation as a whole, has legal documents which state that the women of said region may vote. These official government documents gave our women suffrage.
Bills, laws, and acts were amended or created in order to bring suffrage to the women of Canada. This specific information can be found at: http://www.parl.gc.ca/parlinfo/compilations/provinceterritory/ProvincialWomenRightToVote.aspx. All acts, bills, and statutes are listed below each piece of information. This proves that the social problem has been resolved, as each province, as well as the nation as a whole, has legal documents which state that the women of said region may vote. These official government documents gave our women suffrage.
Evidence 3:
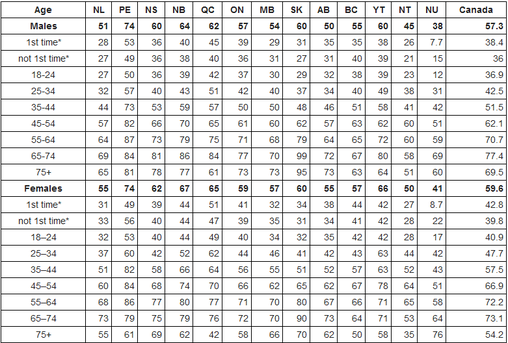
Table 2: Estimated Voter Turnout by Province or Territory, Age Group and Gender, 2011 Federal General Election (courtesy of: http://www.elections.ca/content.aspx?section=res&dir=rec/part/estim/41ge&document=report41&lang=e) This table shows the percent of eligible voters of Canada who voted in the 2011 elections. As shown above, in 21 out of 23 cases, a higher percentage of women rather than men. This means that women have greatly impacted the voting results, and women have certainly used their voting rights more than men.
